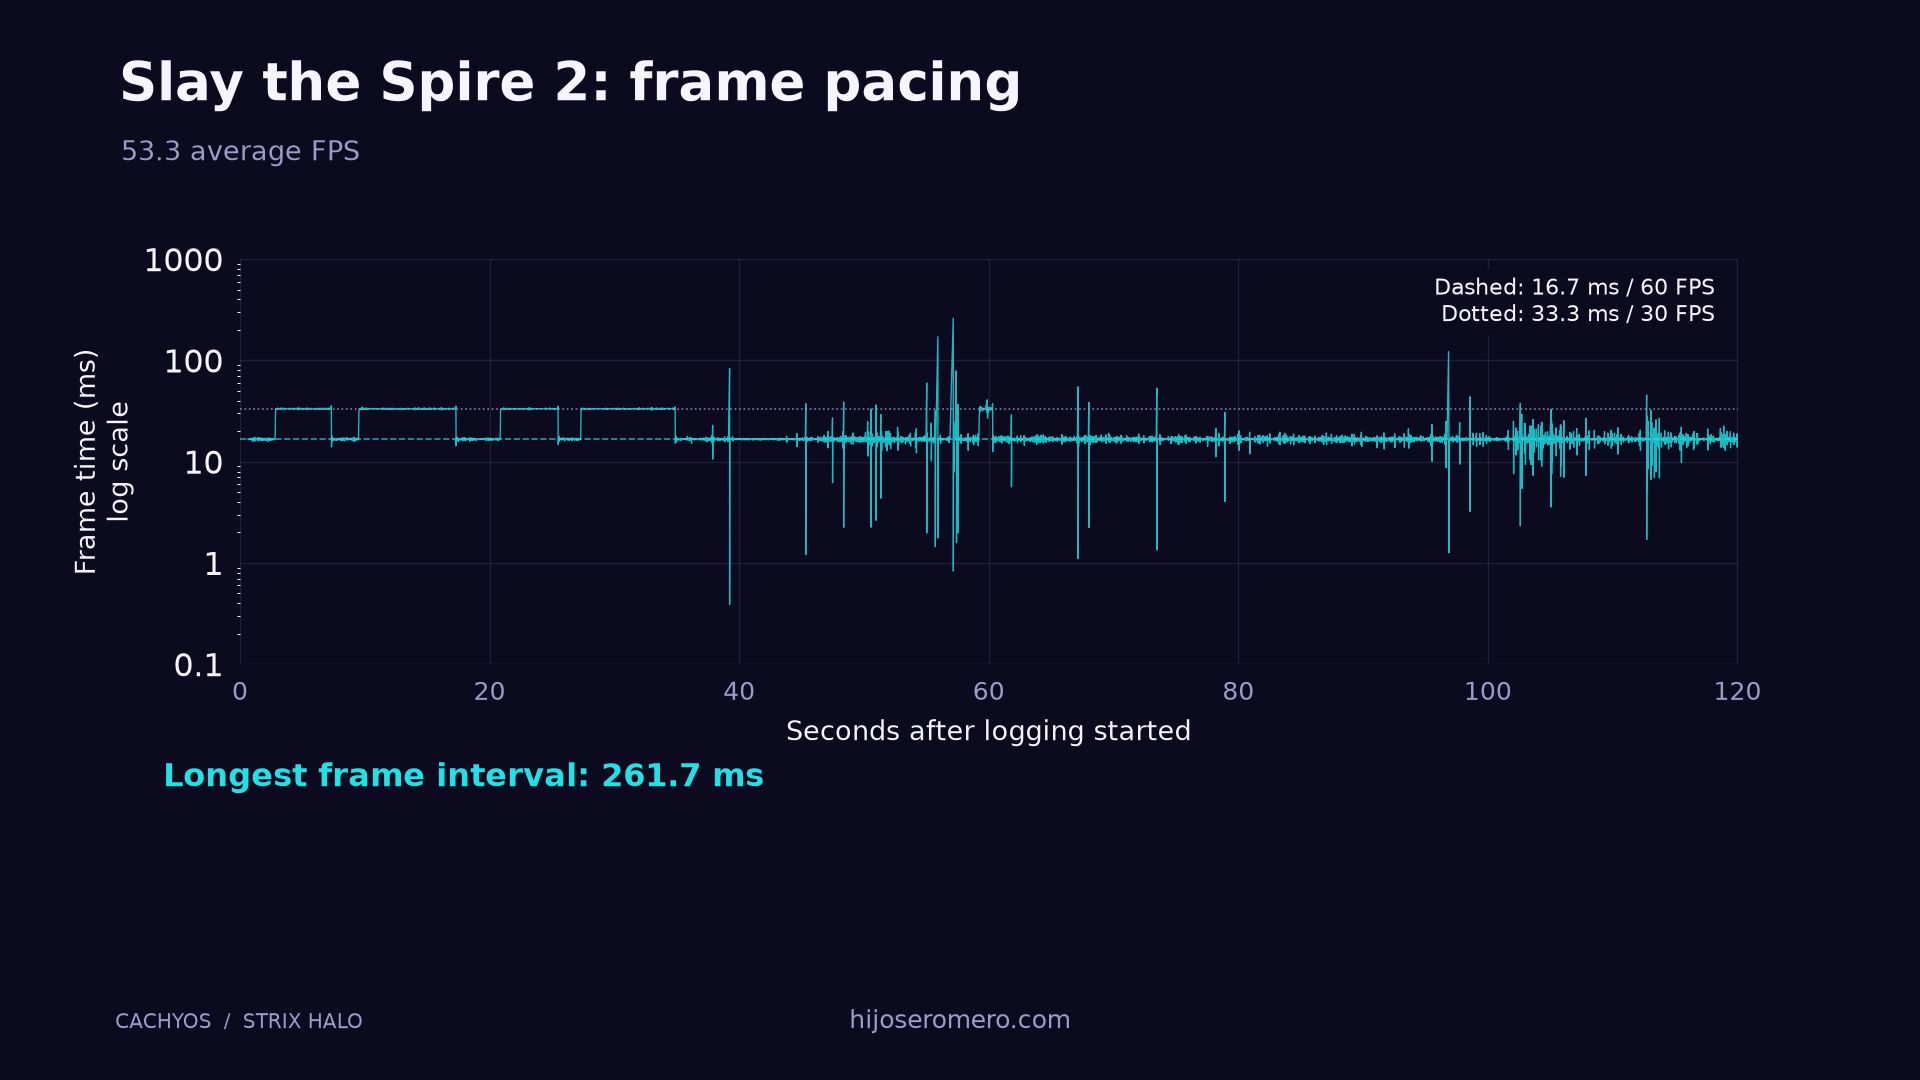
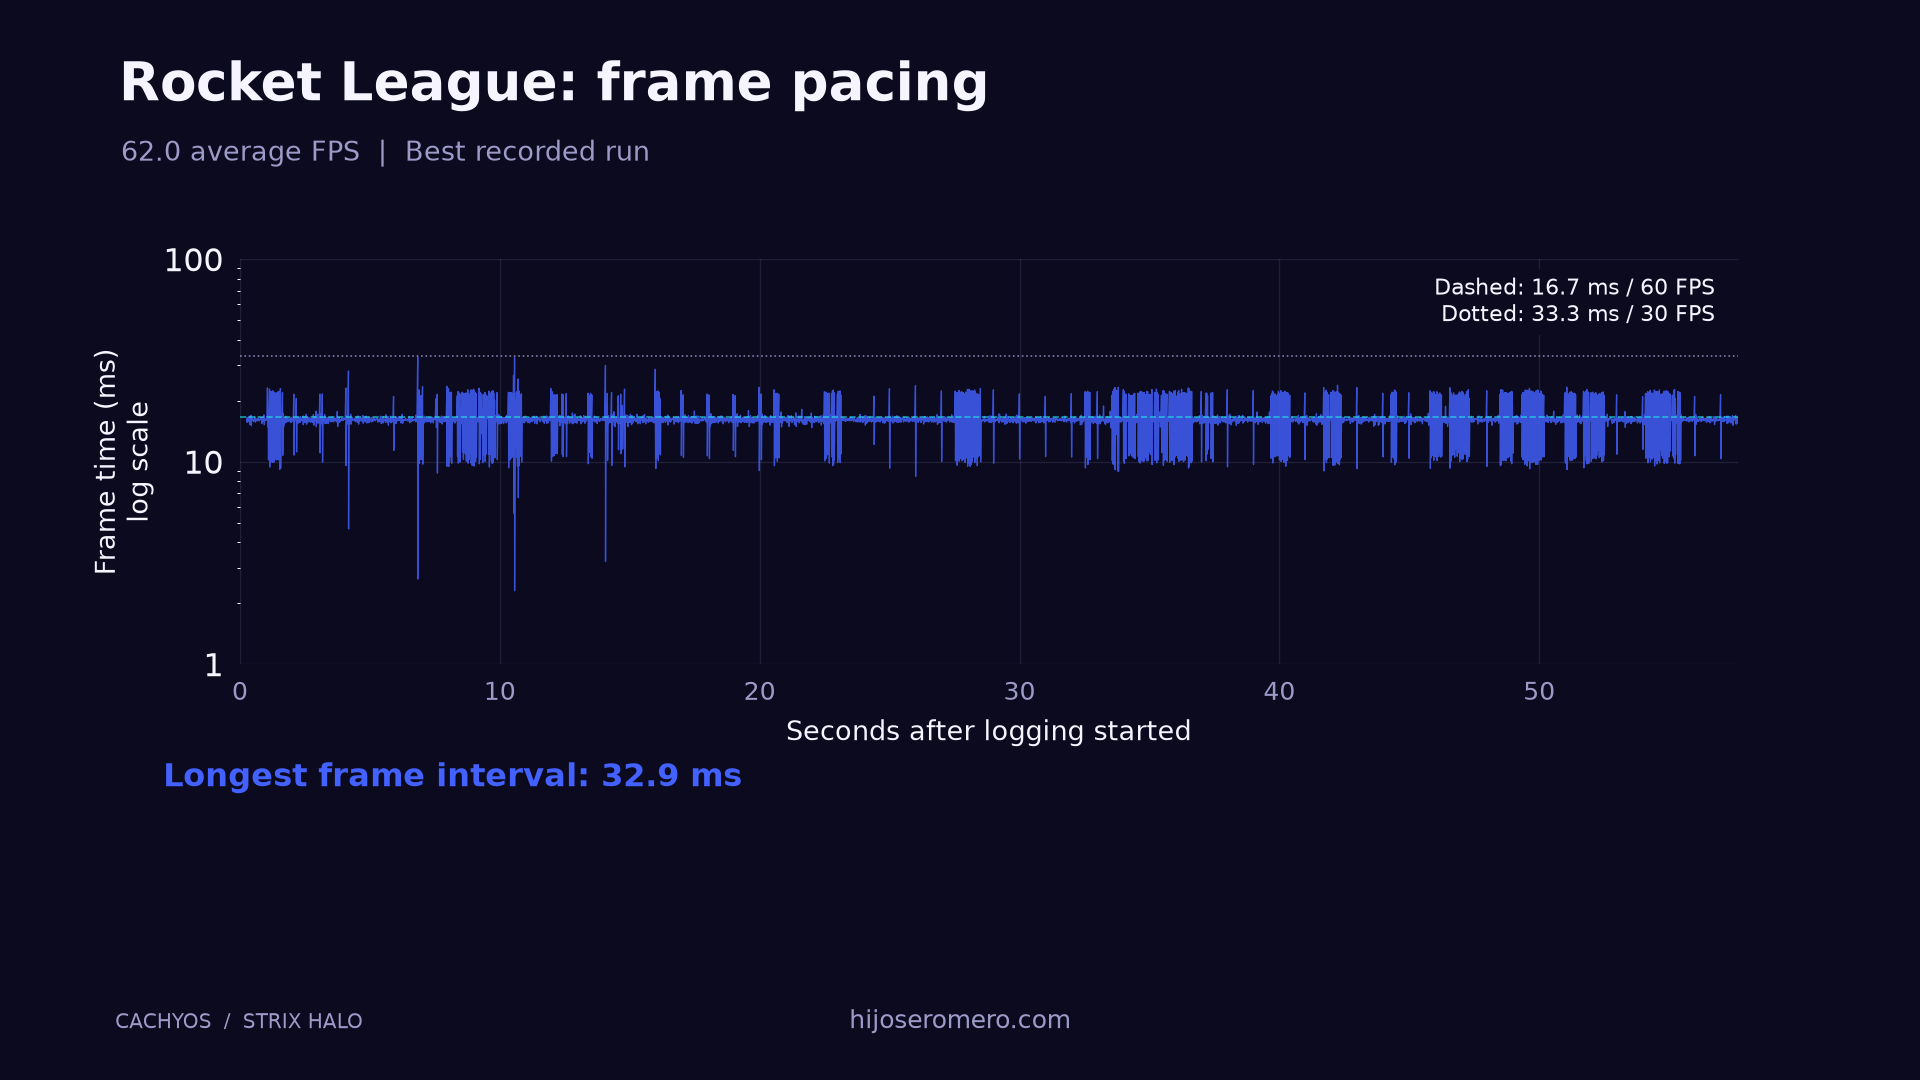
These are current-settings personal snapshots, not repeated controlled tests. Rocket League has two valid runs; this display uses the one with the higher unrounded average FPS and never blends their measurements. All valid captures remain in the downloadable data.
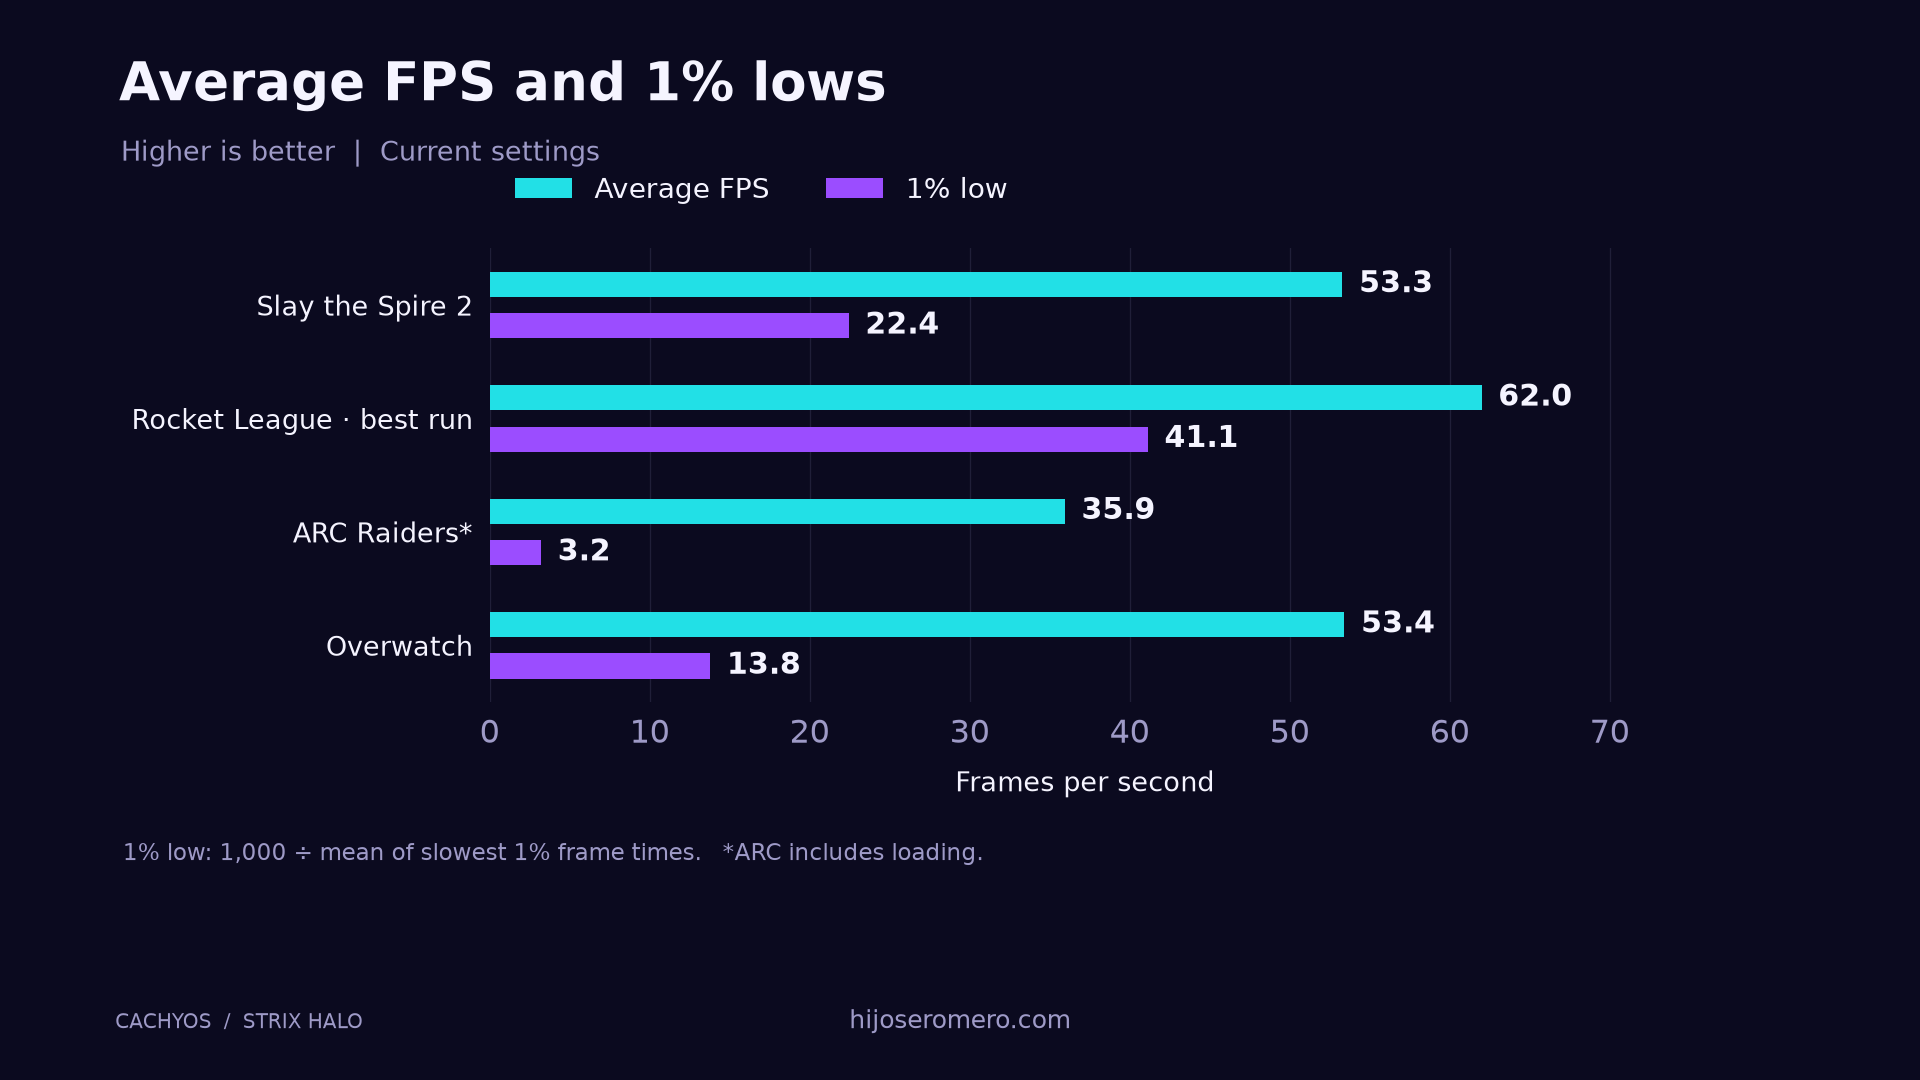
Slay the Spire 253.3 avg FPS
1% low22.4
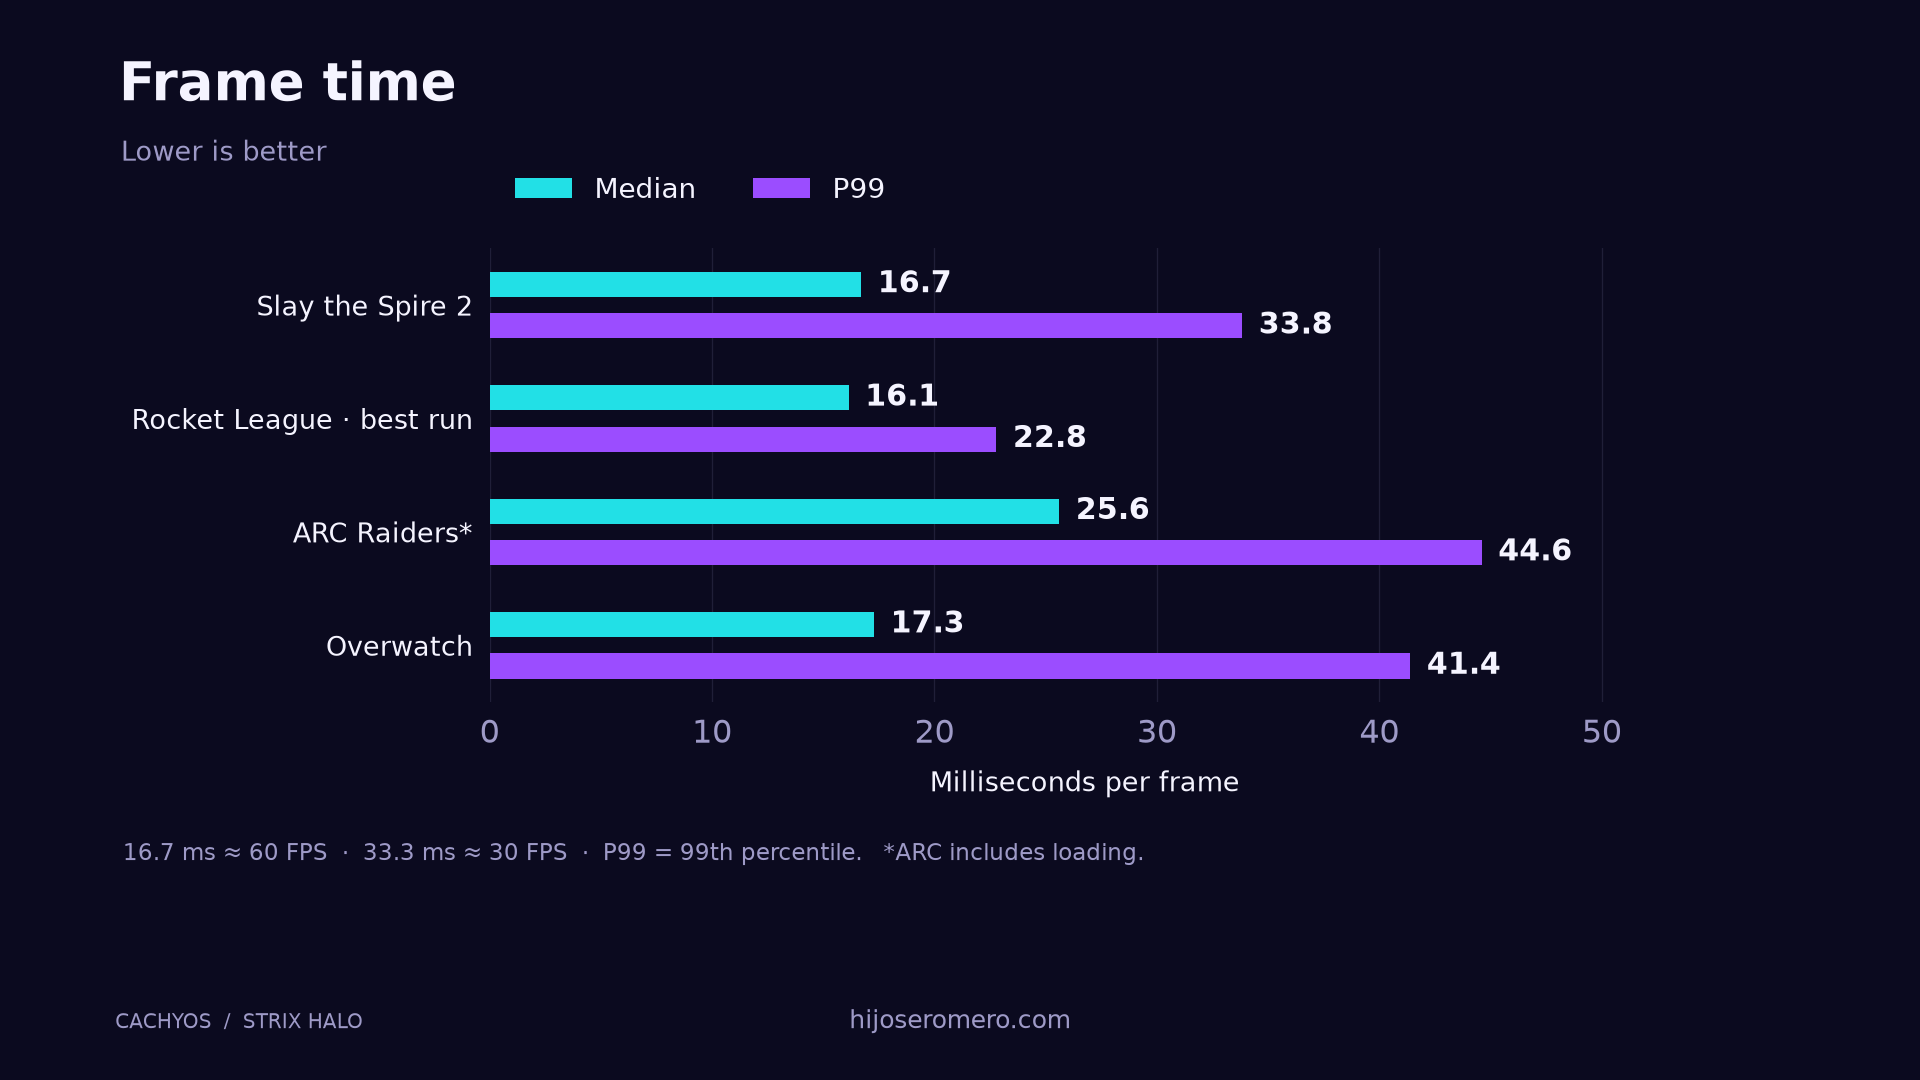
P99 frame time33.8 ms
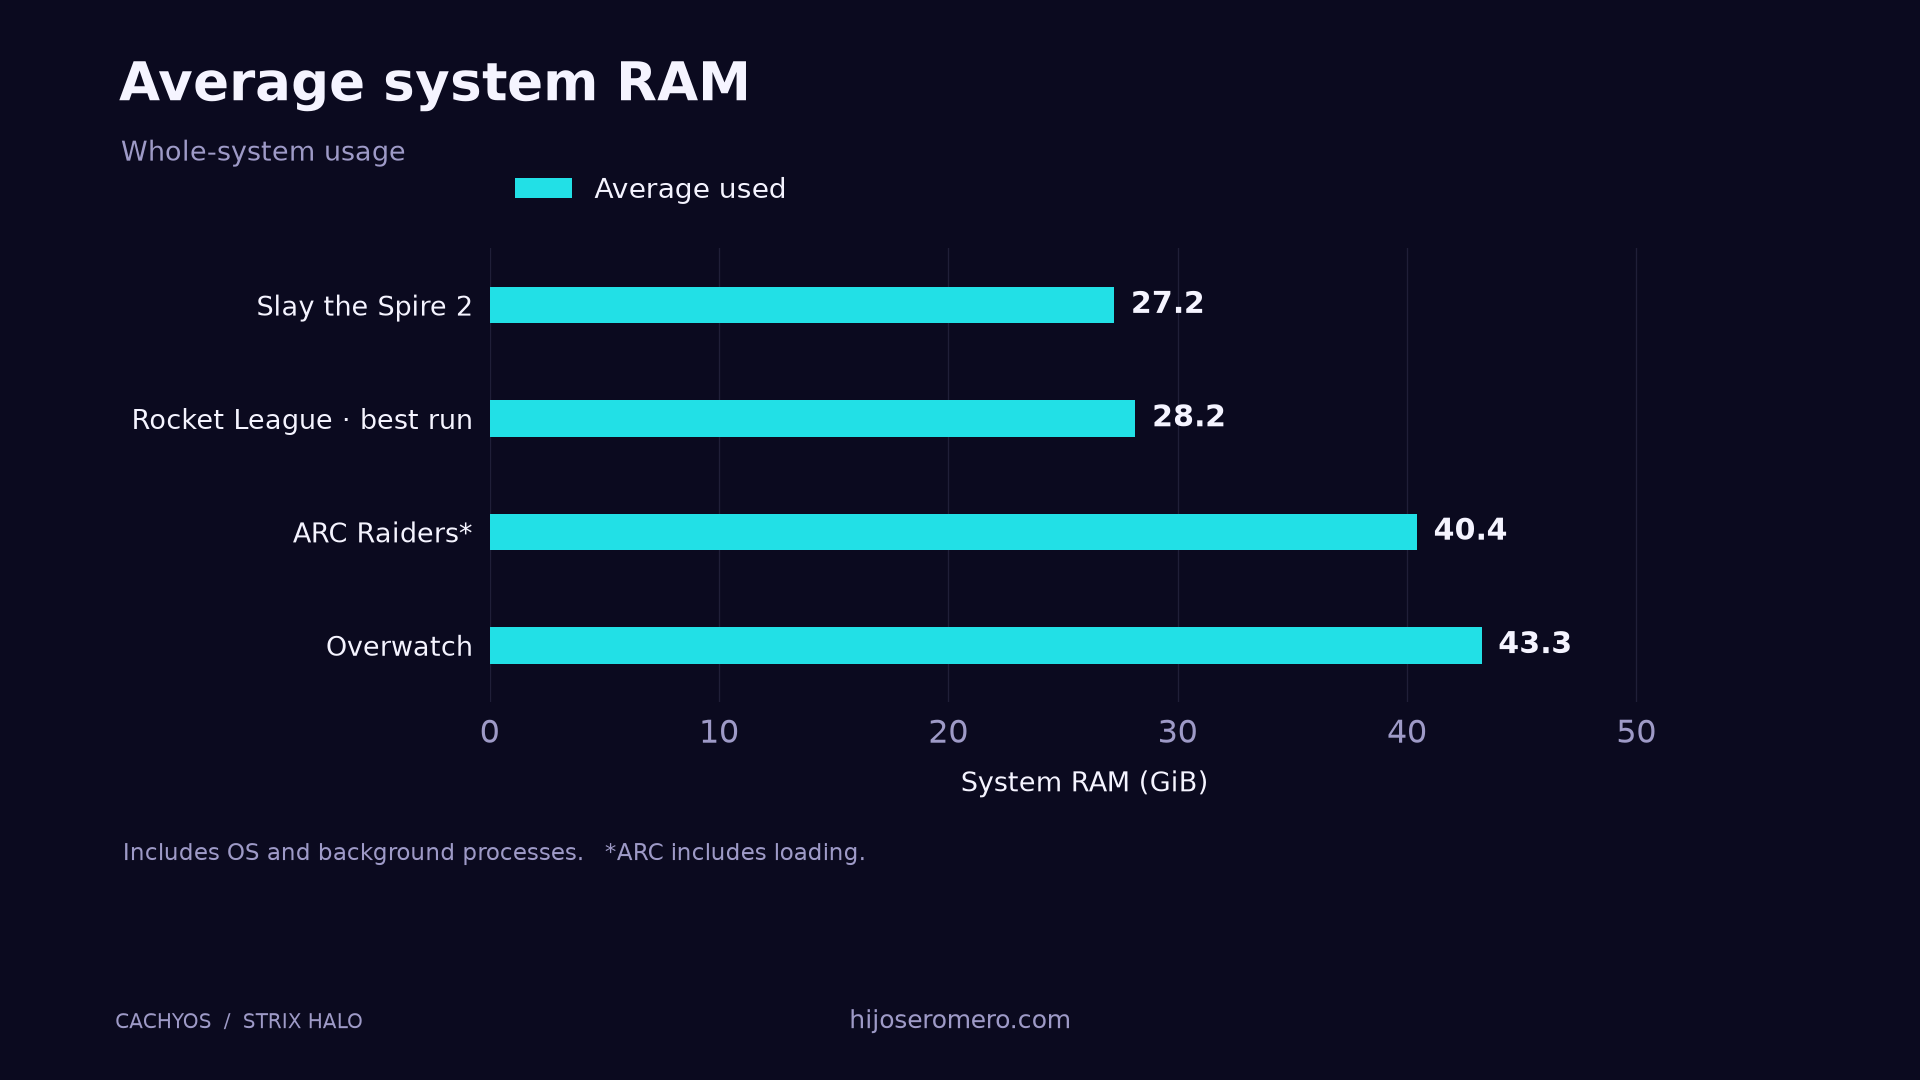
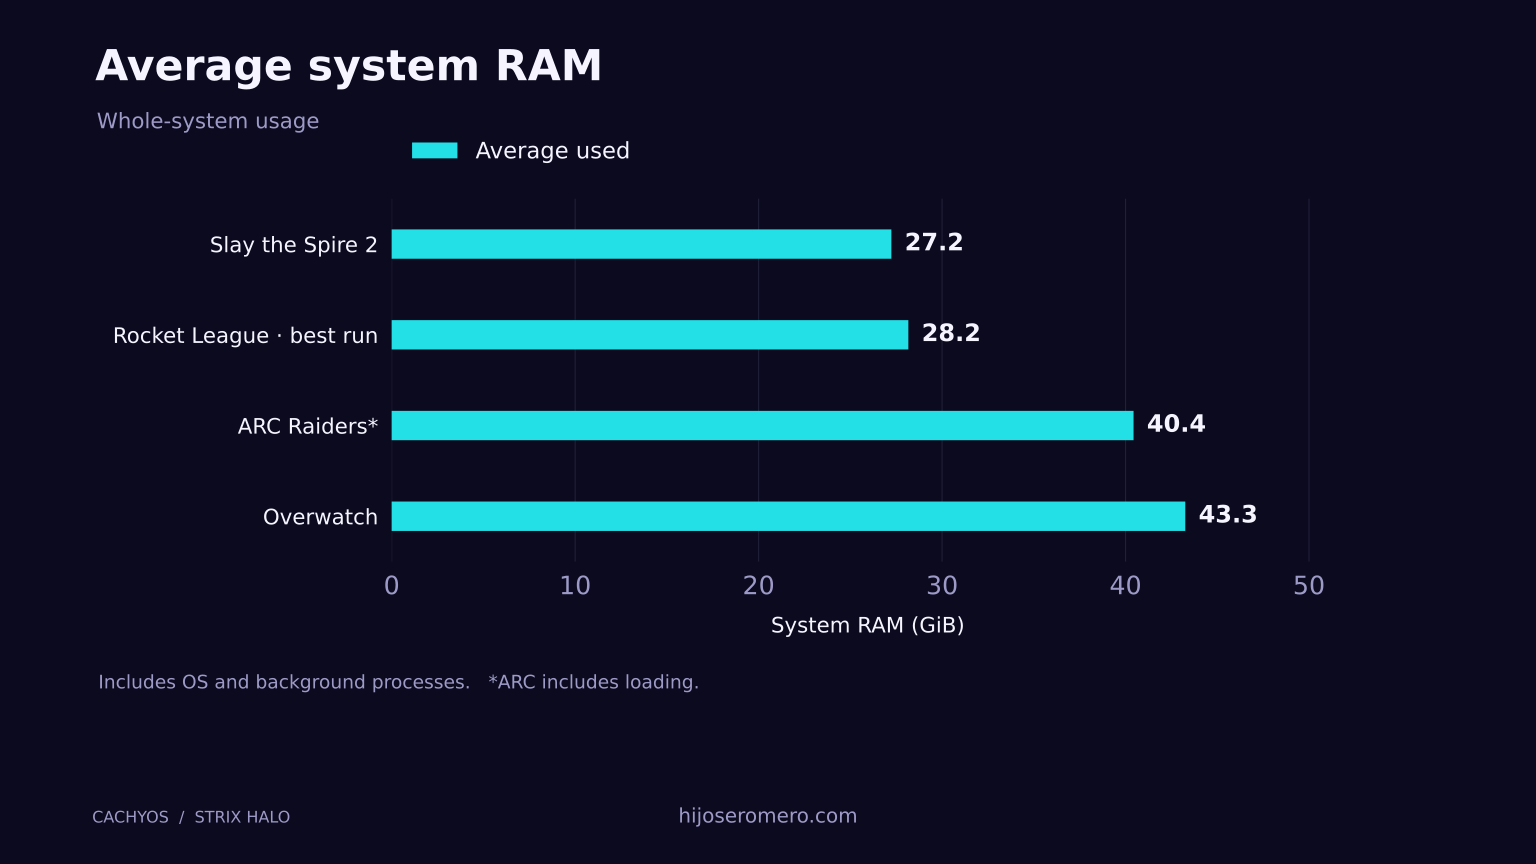
System RAM mean27.2 GiB
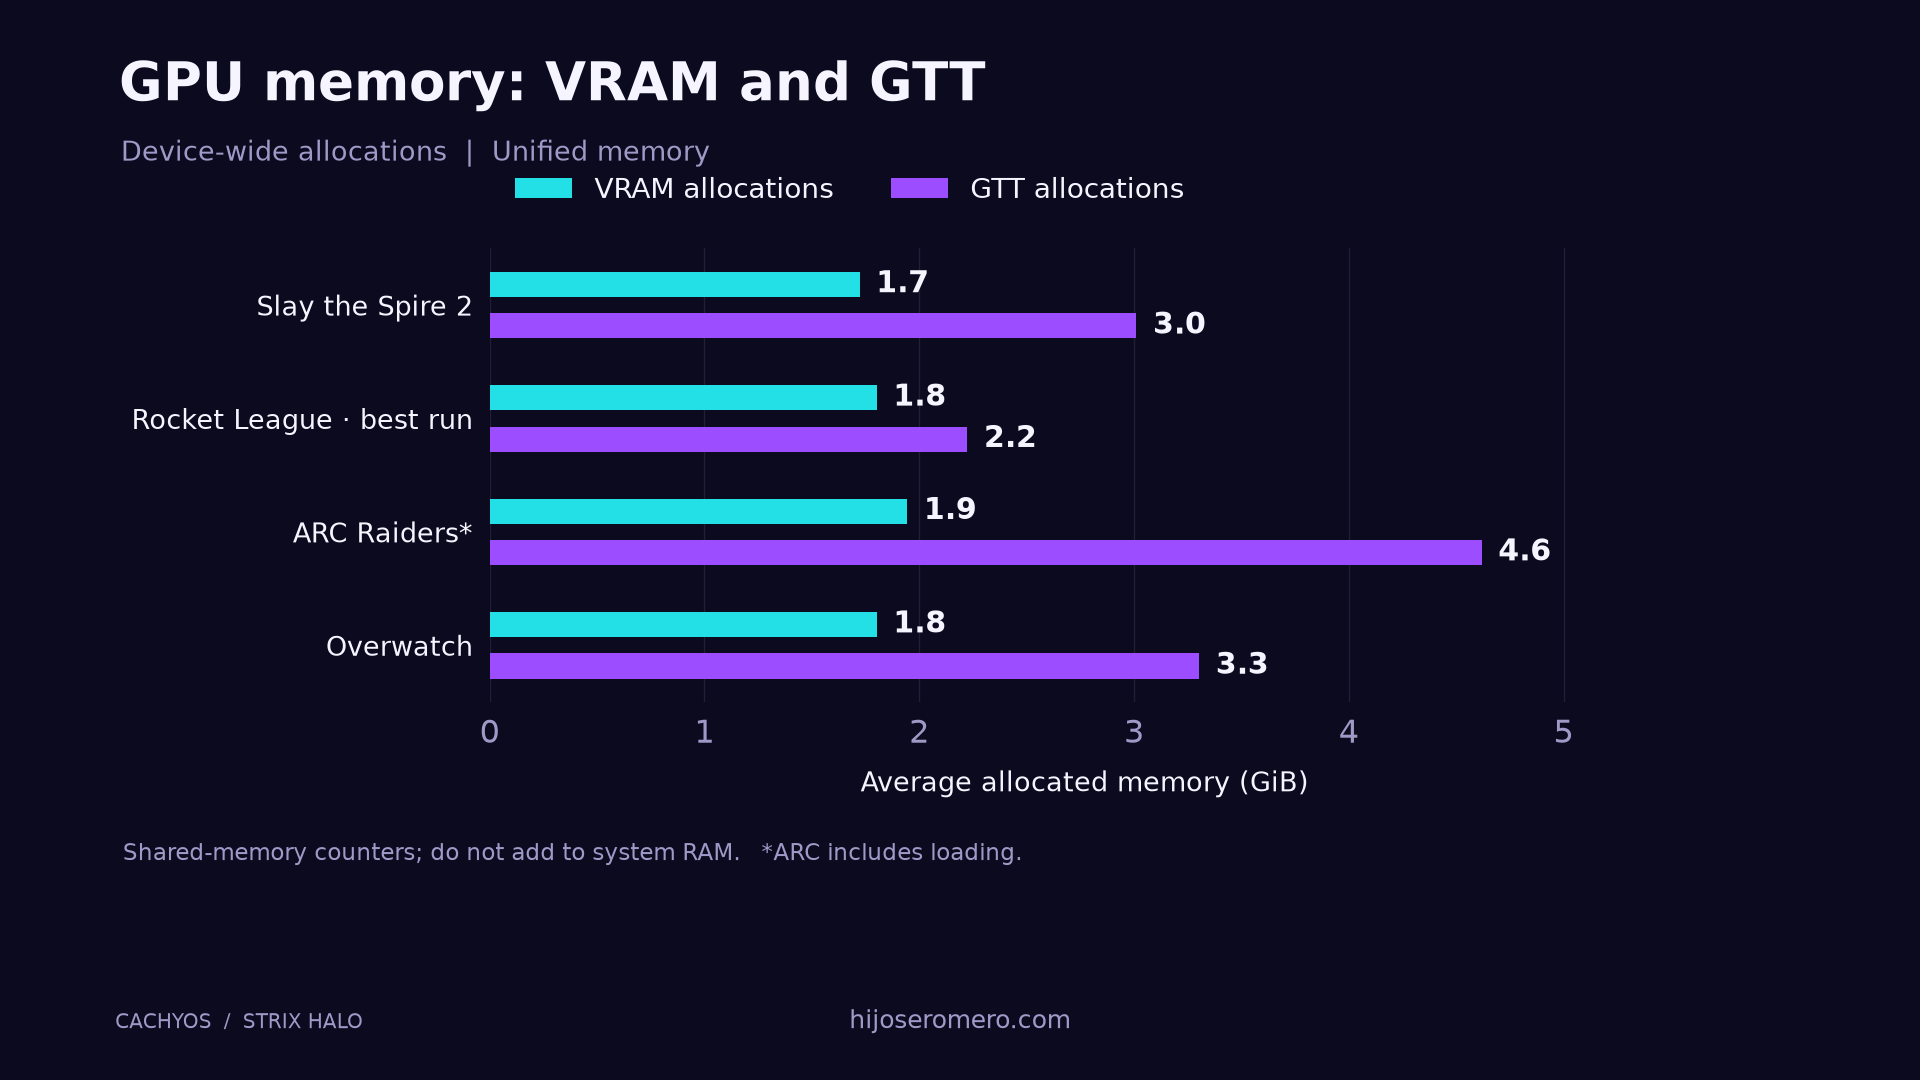
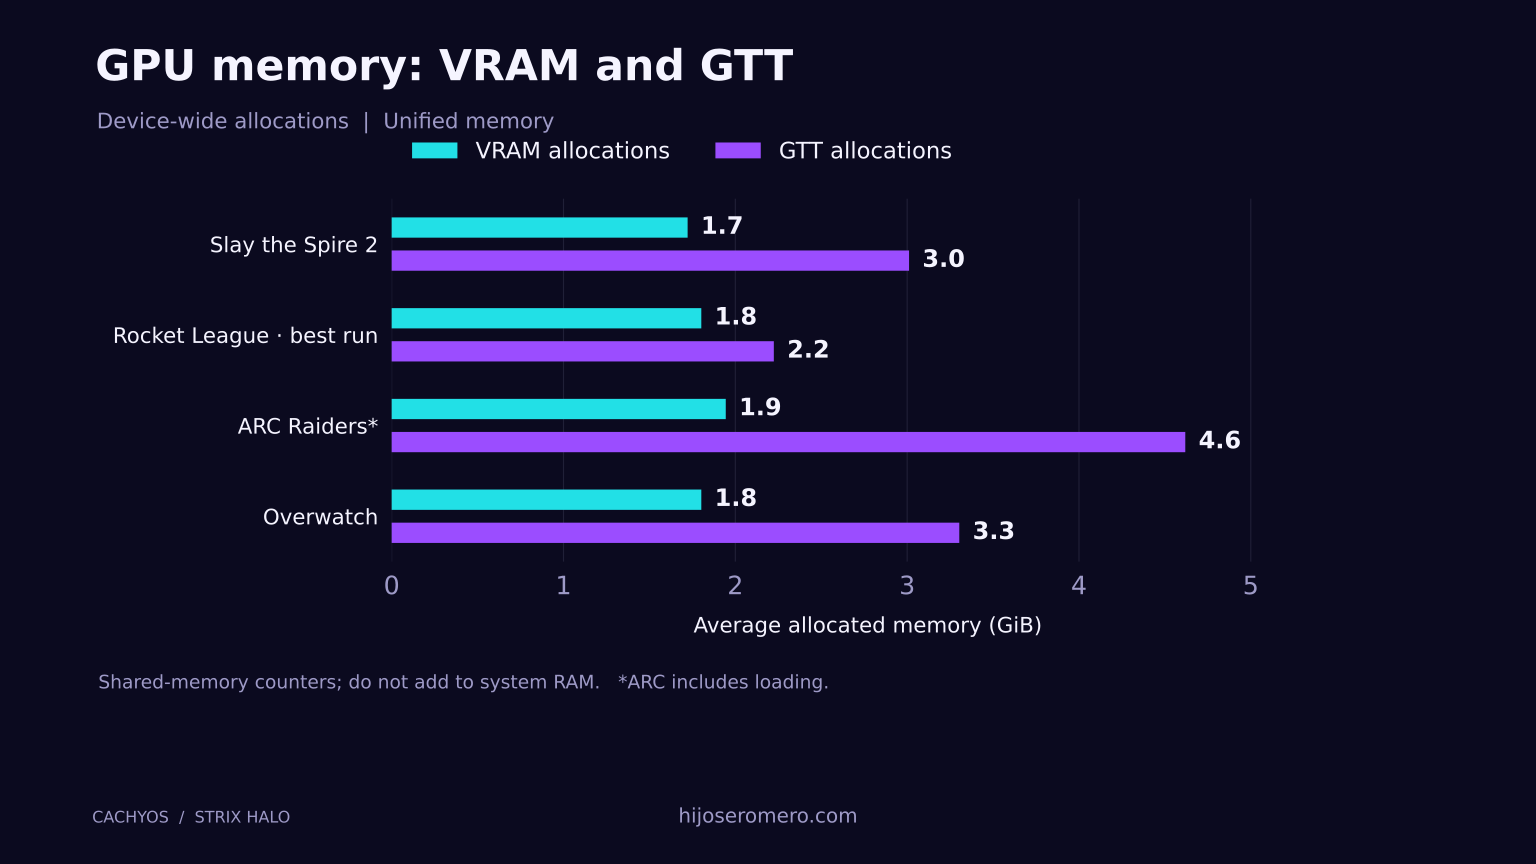
GPU VRAM / GTT mean1.7 / 3.0 GiB
Rocket League62.0 avg FPS
1% low41.1
P99 frame time22.8 ms
System RAM mean28.2 GiB
GPU VRAM / GTT mean1.8 / 2.2 GiB
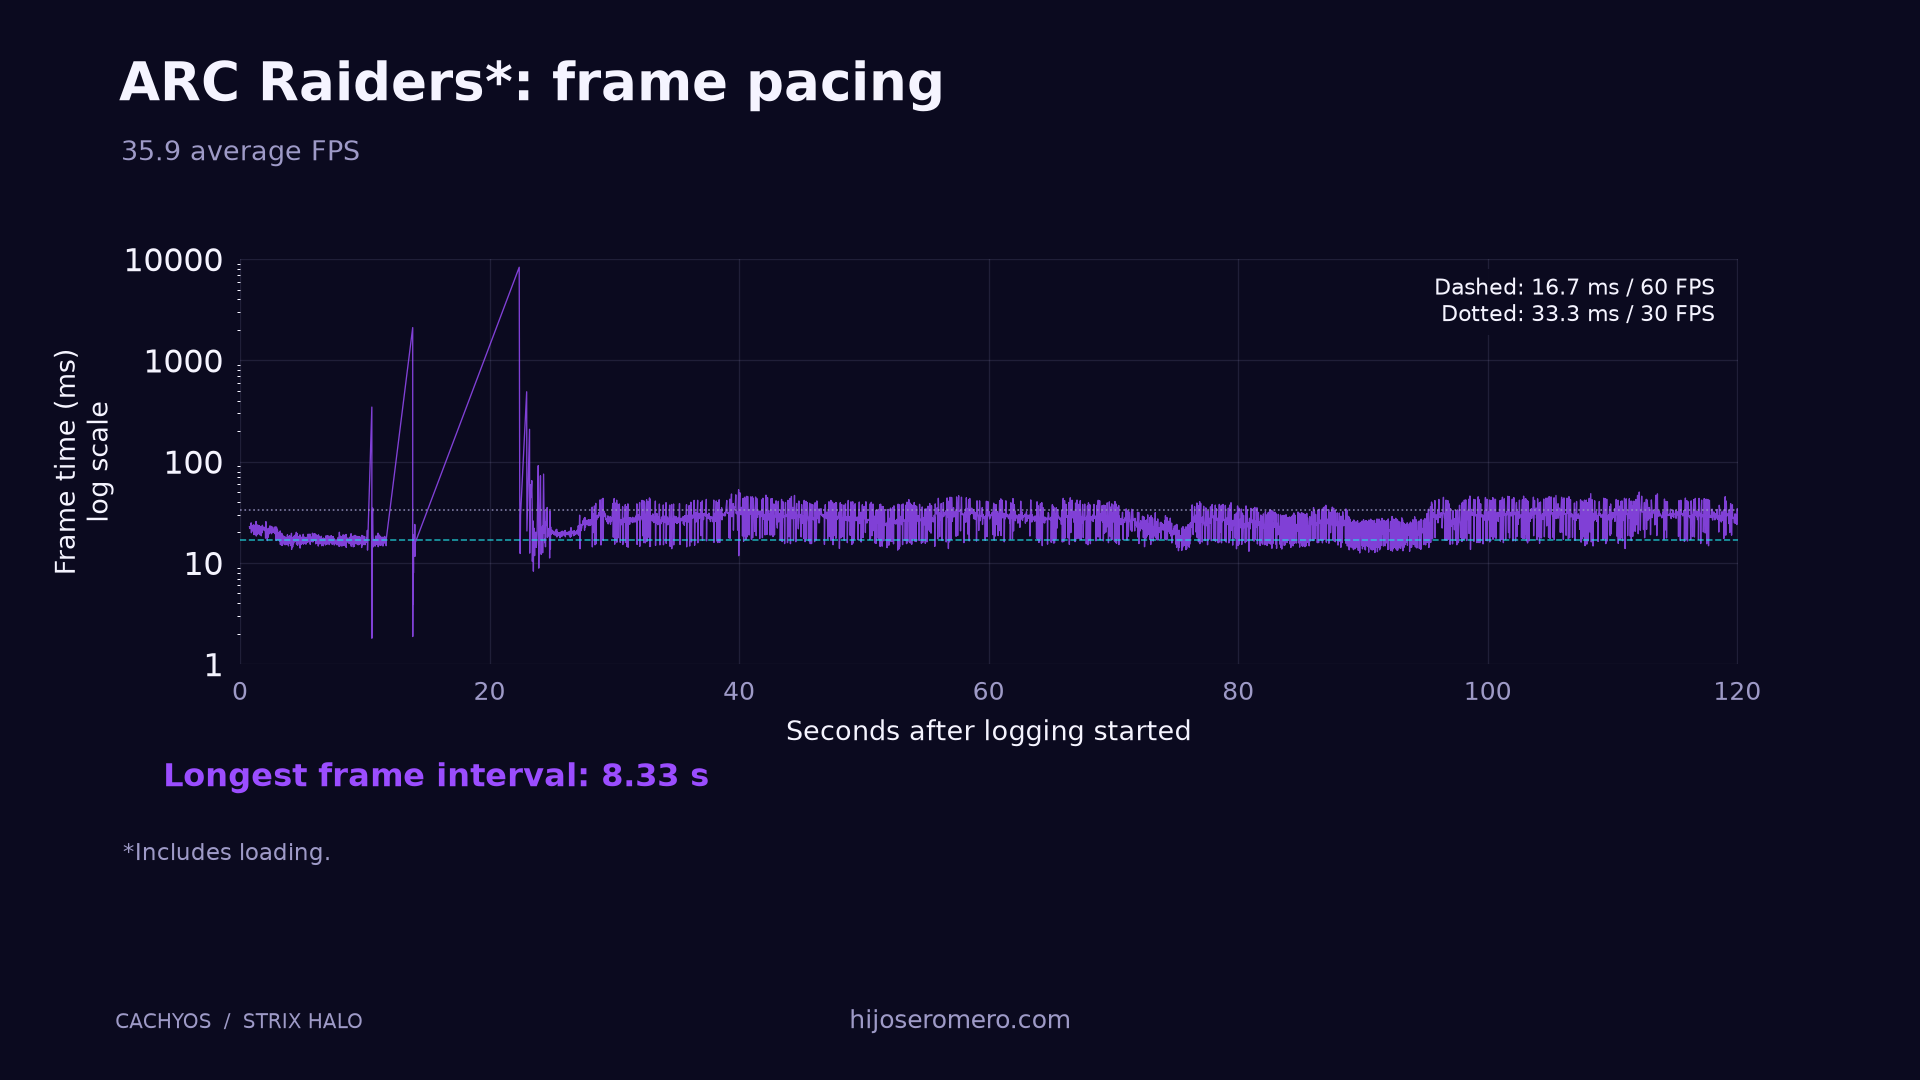
ARC Raiders35.9 avg FPS
1% low3.2
P99 frame time44.6 ms
System RAM mean40.4 GiB
GPU VRAM / GTT mean1.9 / 4.6 GiB
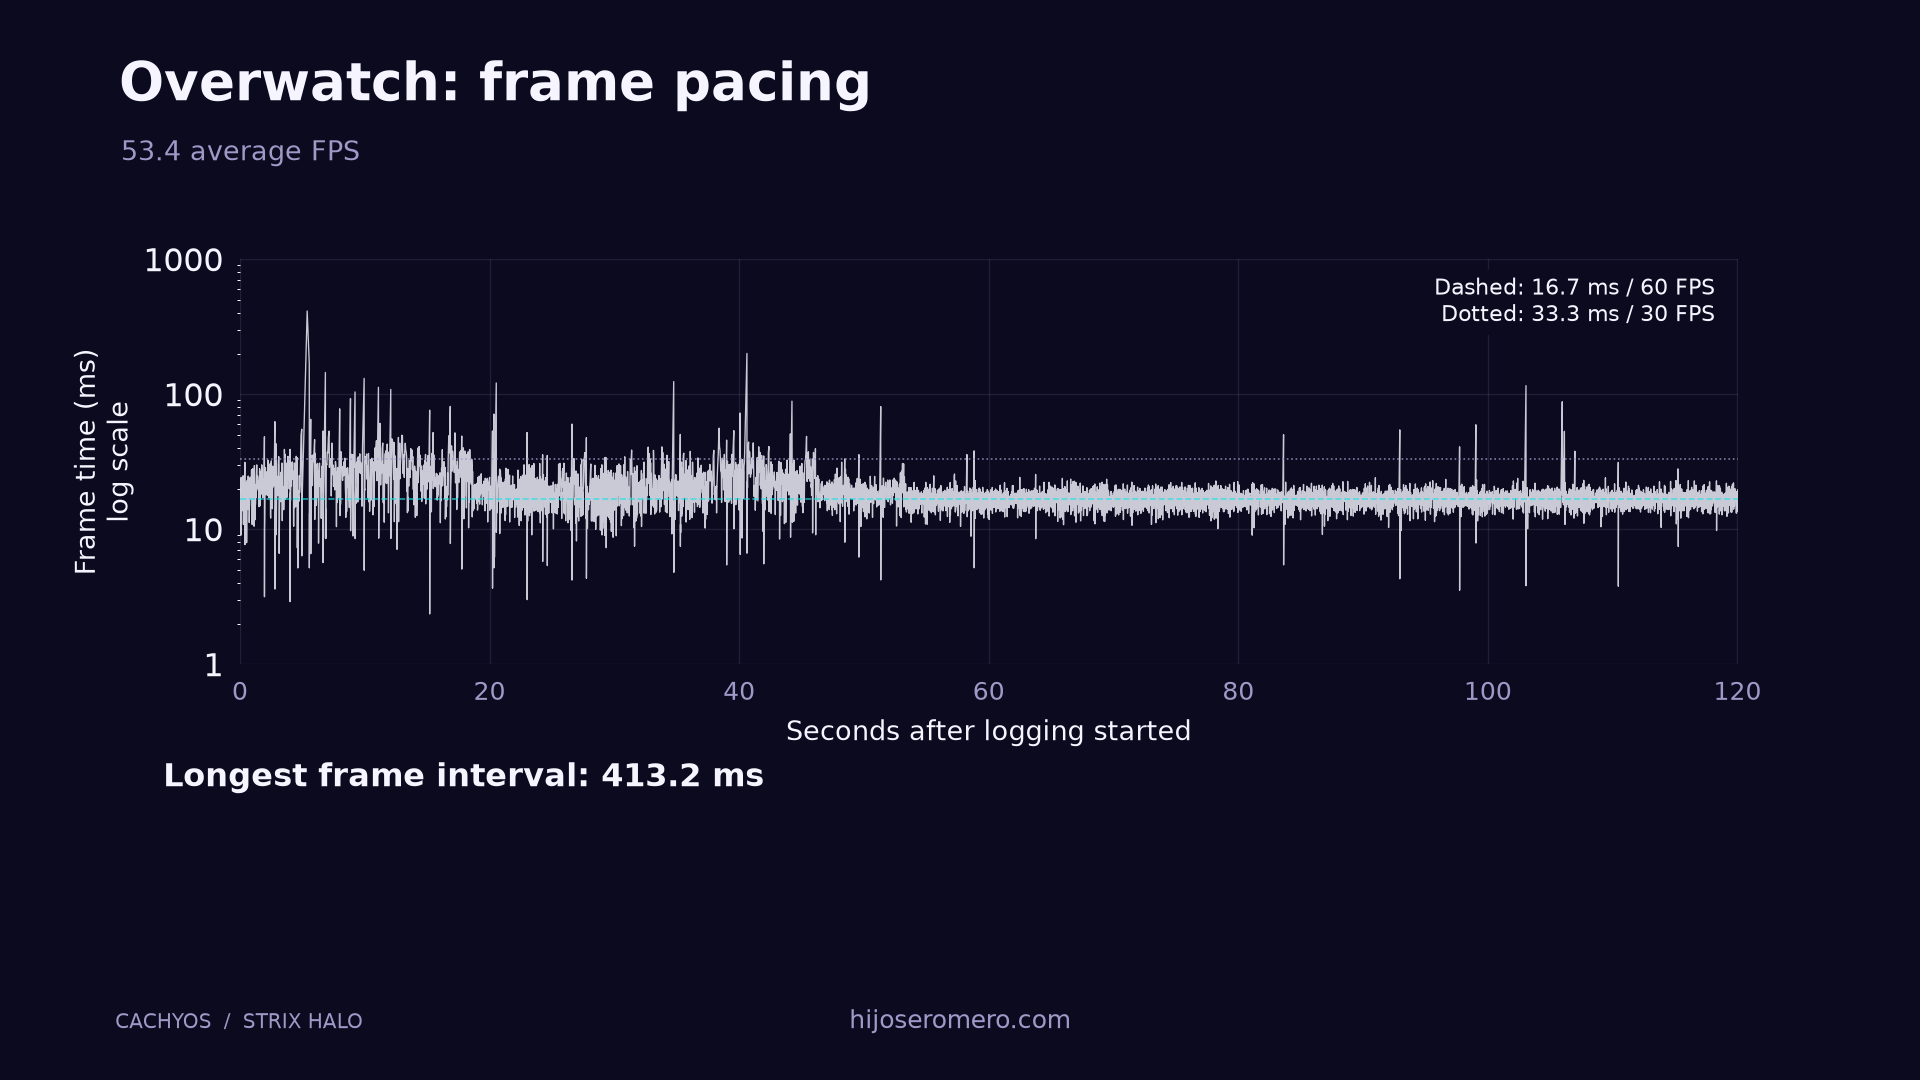
Overwatch53.4 avg FPS
1% low13.8
P99 frame time41.4 ms
System RAM mean43.3 GiB
GPU VRAM / GTT mean1.8 / 3.3 GiB
Read the ARC Raiders result with its loading period. The full capture includes loading and two large frame gaps near visible loading/tip screens. Its 3.2 FPS calculated 1% low is not a sustained active-gameplay rate. The captured footage mainly shows traversal, not a demanding firefight.
Game
Avg FPS
1% low FPS
P99 frame ms
System RAM GiB
VRAM GiB
GTT GiB
Capture s
Slay the Spire 2
53.3
22.4
33.8
27.2
1.7
3.0
120.0
Rocket League
62.0
41.1
22.8
28.2
1.8
2.2
57.6
ARC Raiders
35.9
3.2
44.6
40.4
1.9
4.6
120.0
Overwatch
53.4
13.8
41.4
43.3
1.8
3.3
120.0
RAM, VRAM and GTT are mean readings over approximately aligned capture windows. These accounting views overlap on a unified-memory machine; do not add them together.
Visual evidence
FPS, pacing and memory
Average FPS and calculated 1% lows Higher is better. ARC Raiders includes loading. SVGFrame-time pacing P99 frame time and long frames add context that an average FPS hides. SVG
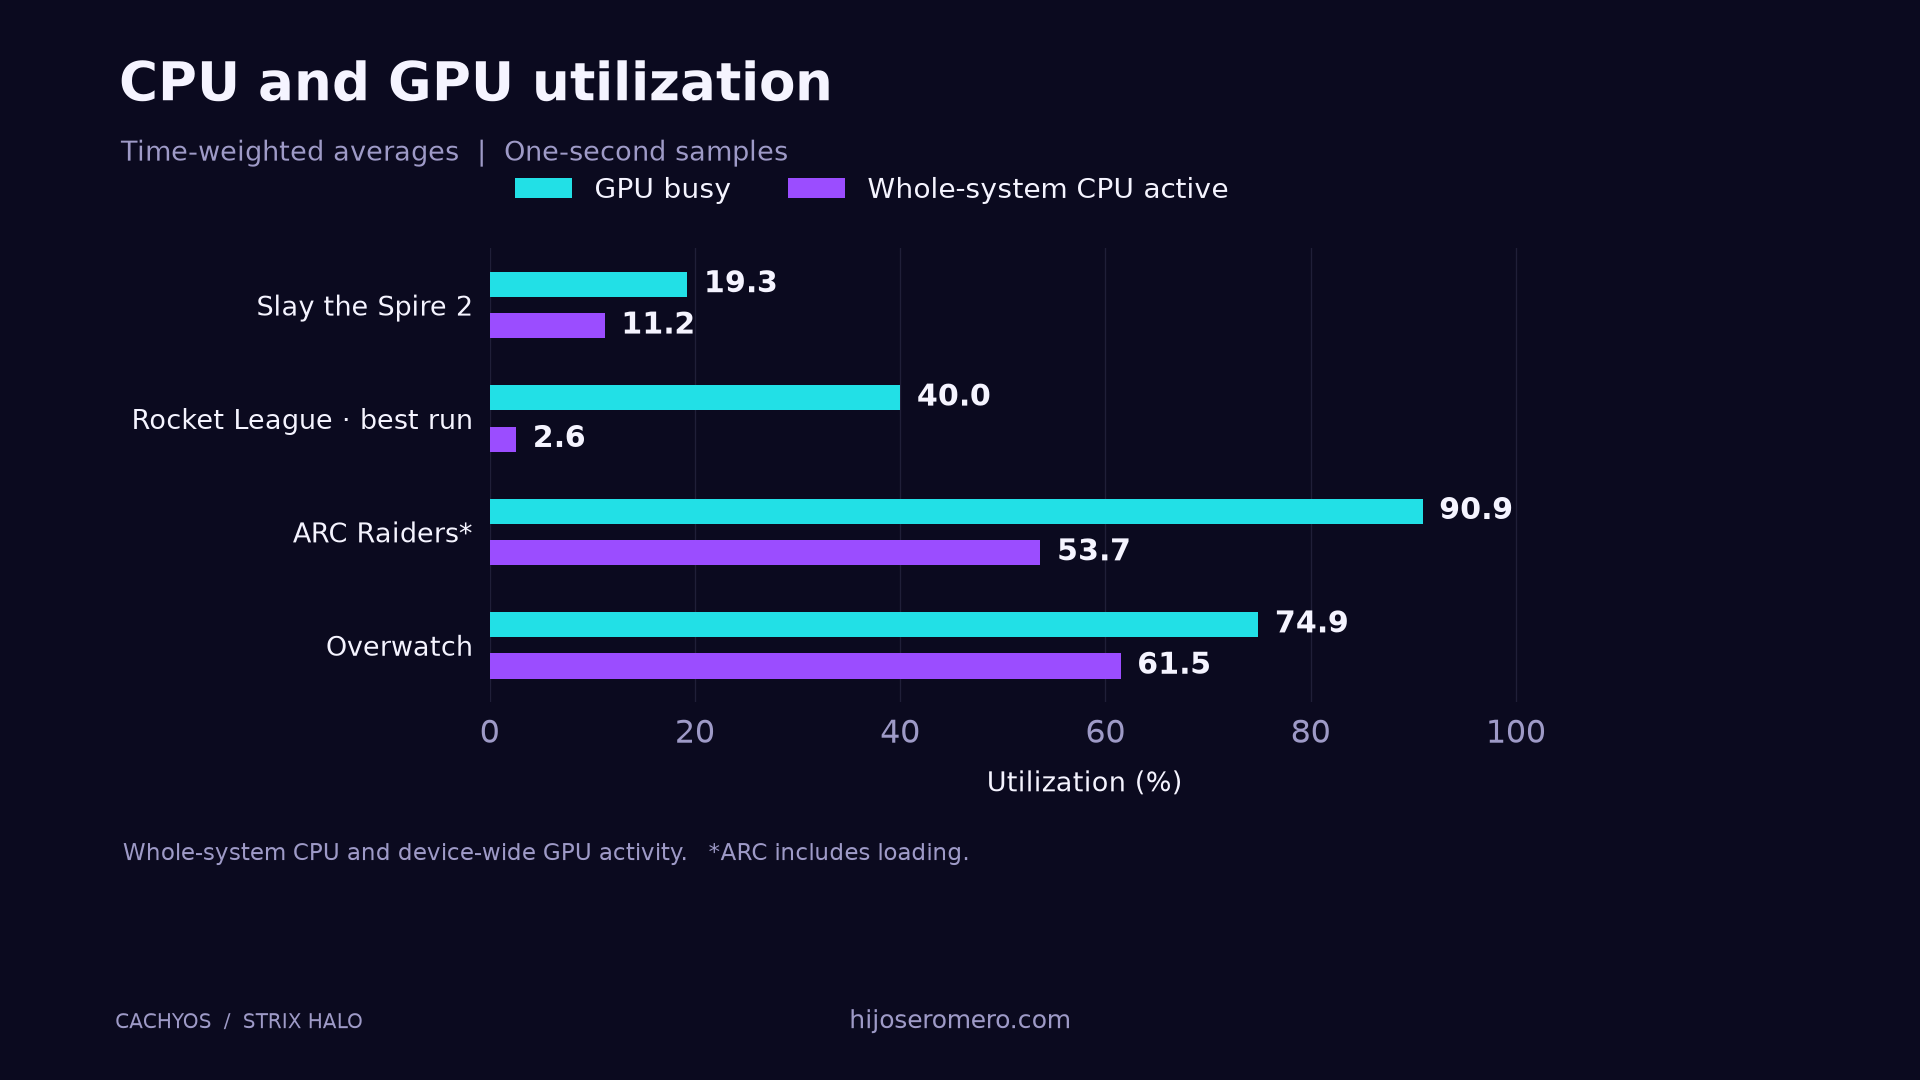
Whole-system RAM Includes the operating system and other processes. SVGGPU VRAM and GTT Driver-reported device allocations, overlapping unified-memory views. SVG
Open per-game frame-time timelines and system loadSlay the Spire 2 frame-time timeline Menus, setup and combat appear in the capture. SVGRocket League selected-run timeline The selected run has the higher unrounded average FPS. SVGARC Raiders frame-time timeline The loading portion is retained. SVGOverwatch frame-time timeline Open Queue match, including a scoreboard. SVGCPU, GPU and APU sensor load Whole-system and device-wide measurements, approximately aligned. SVGObserved setup
What the settings screens showed
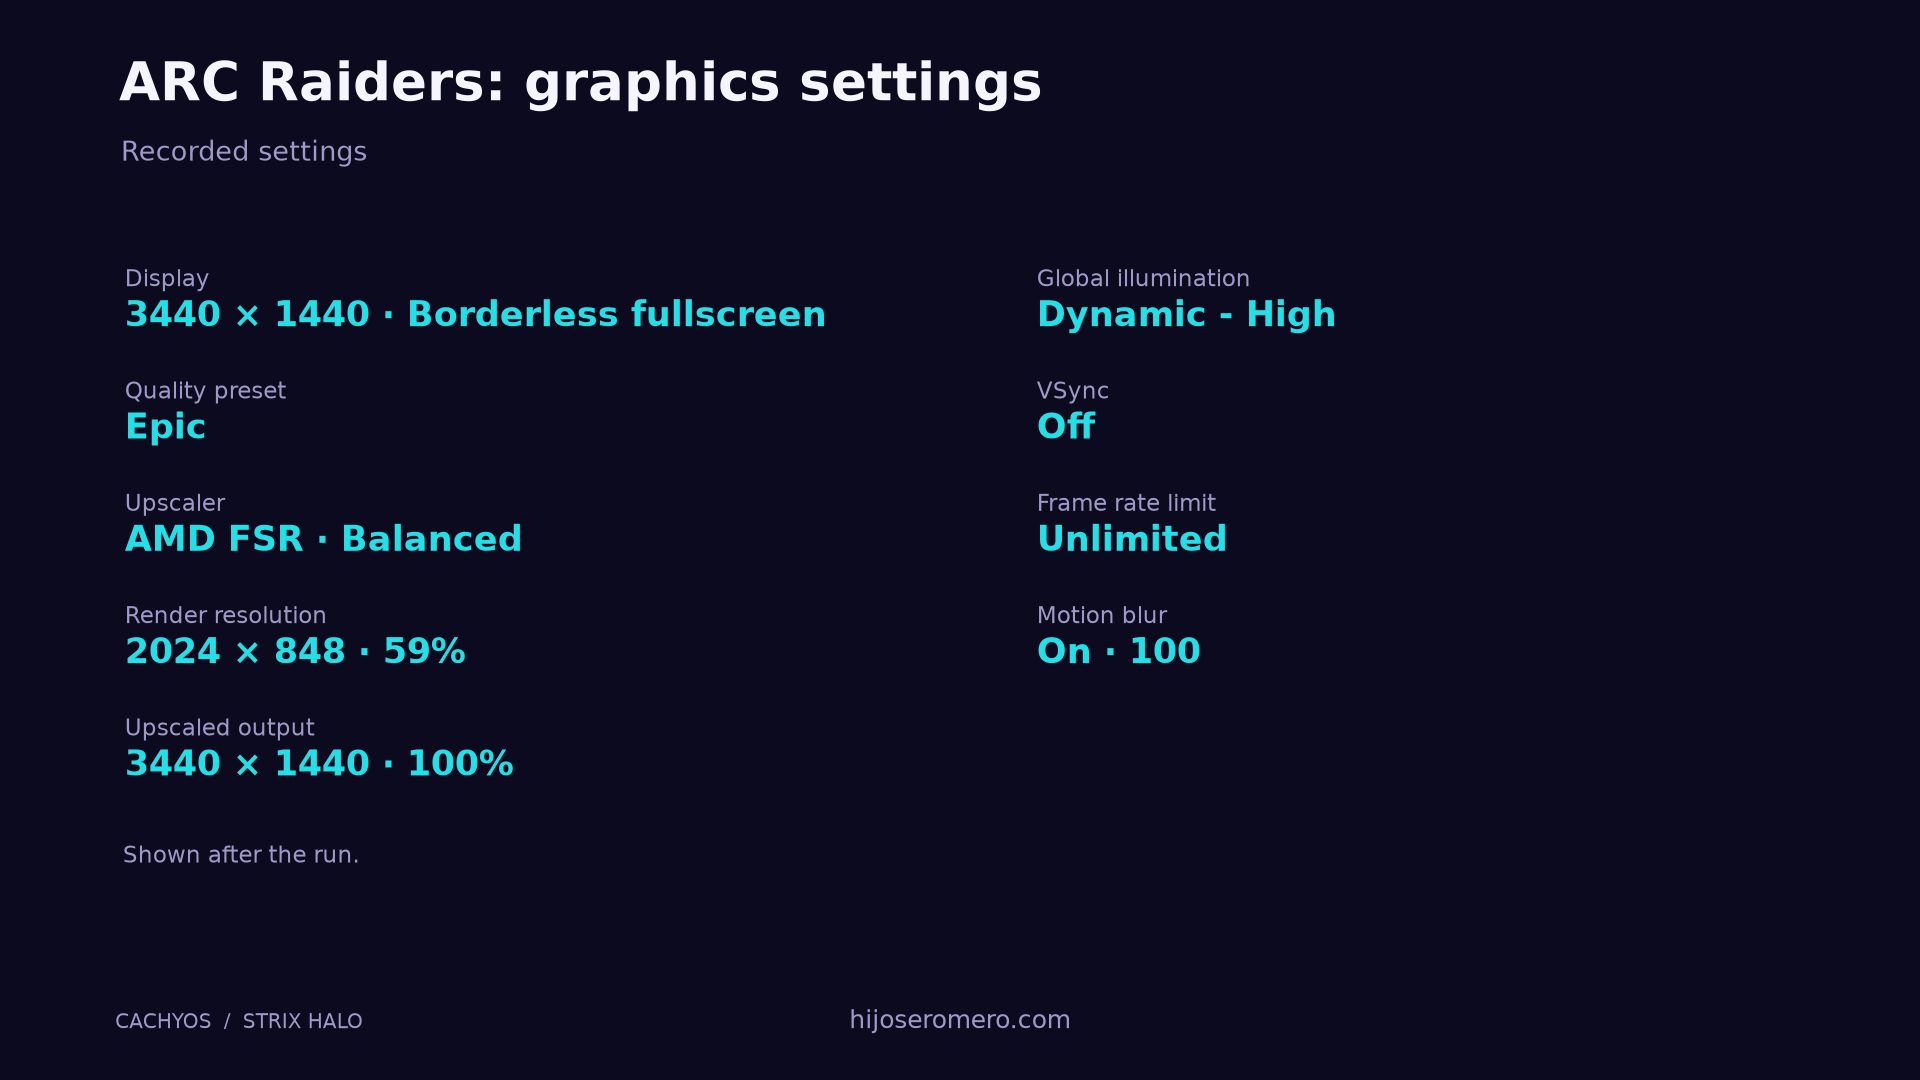
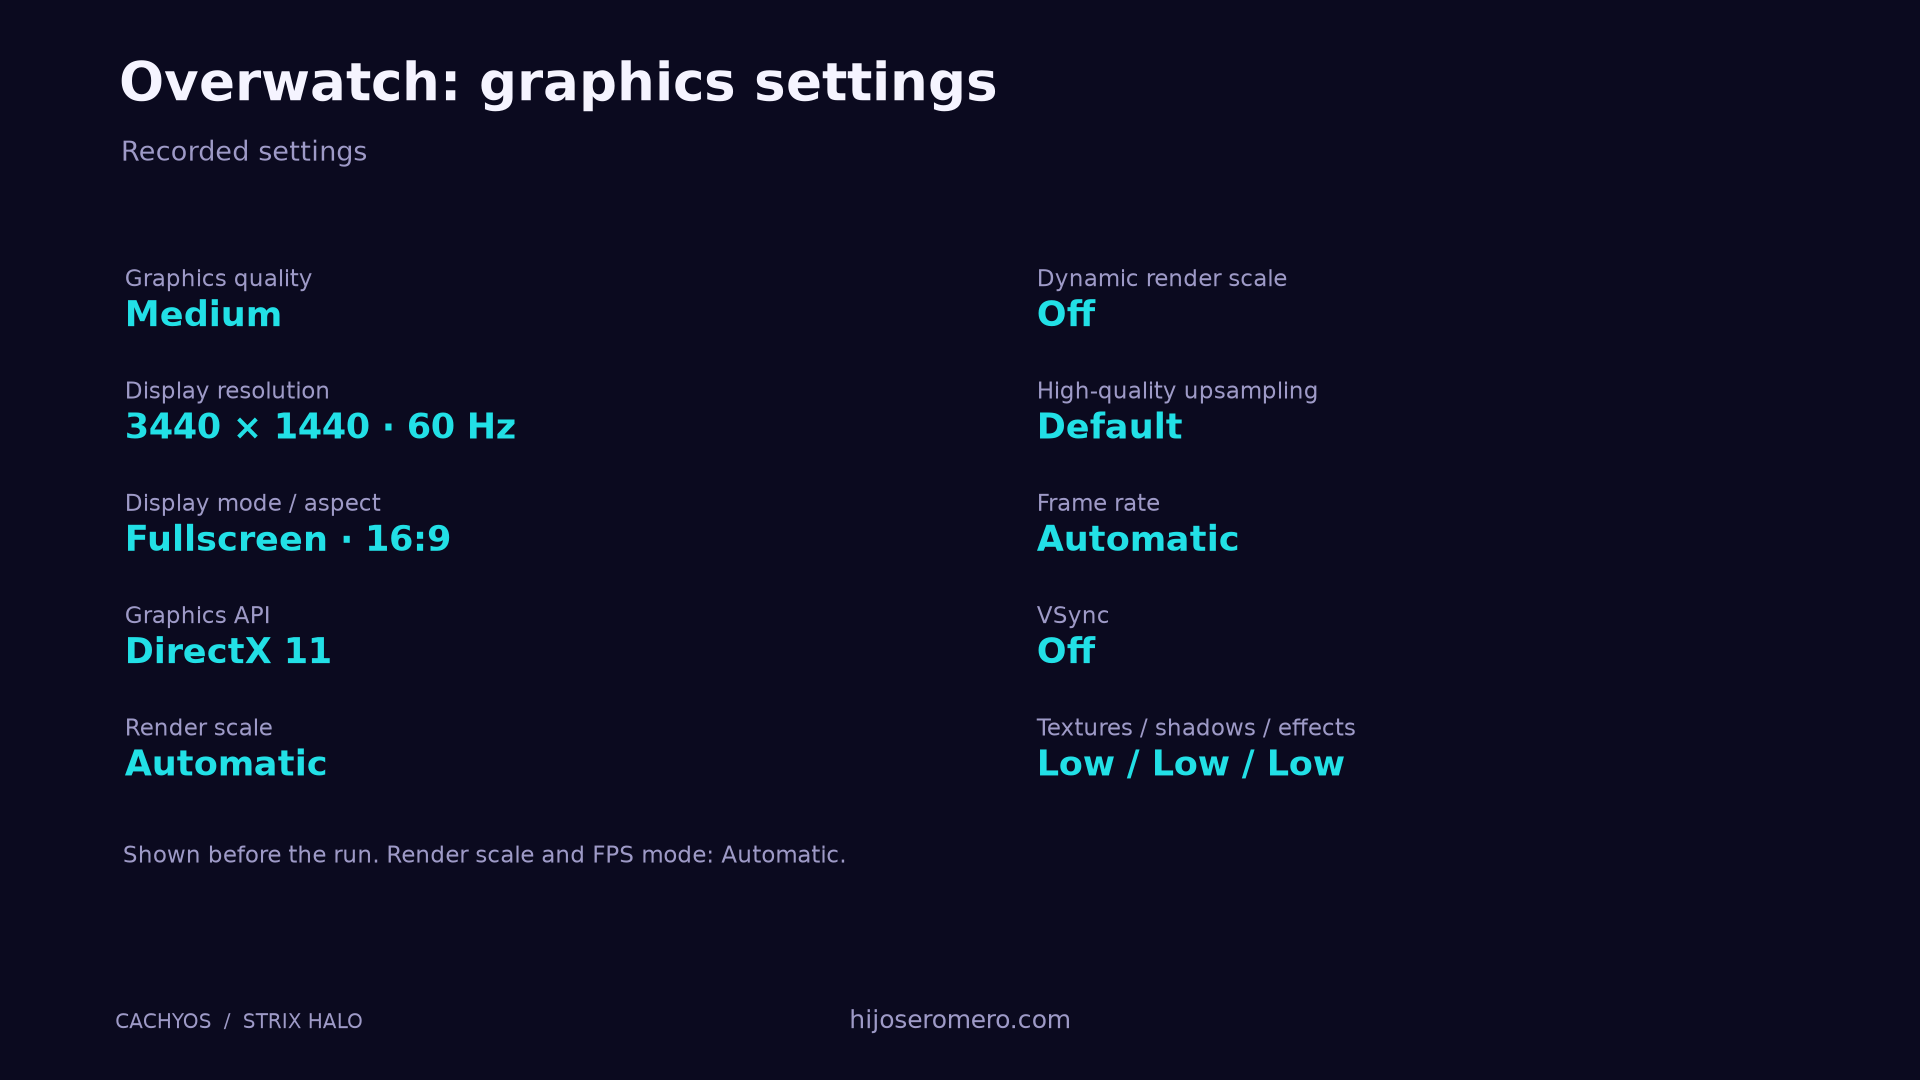
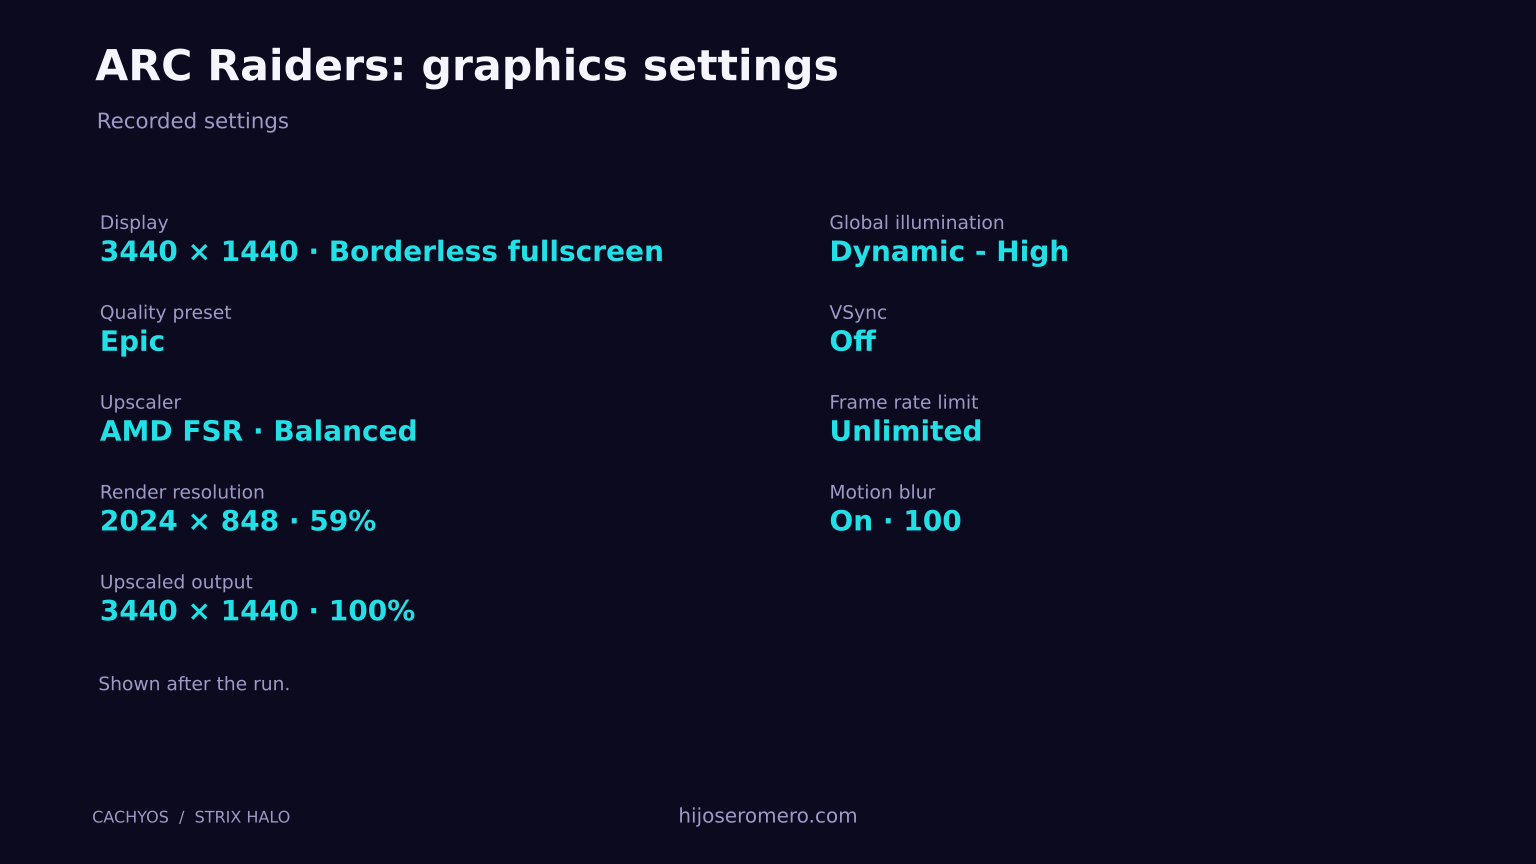
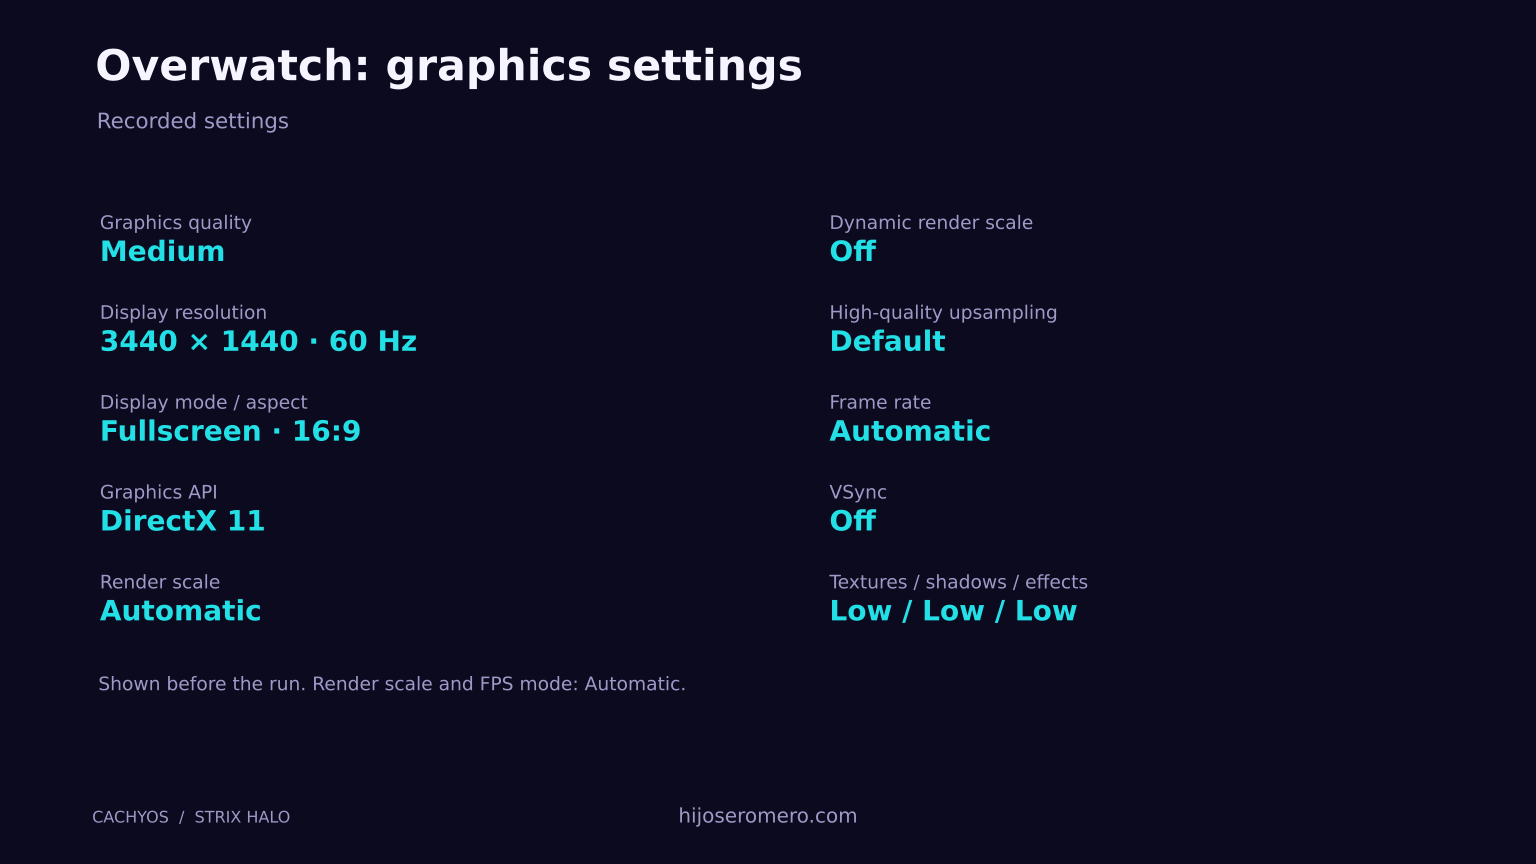
ARC Raiders settings were observed after its capture. Overwatch settings were observed before its capture. These are documented screen states, not proof that every setting stayed fixed throughout play. Slay the Spire 2 and Rocket League settings were not completely recorded.
ARC Raiders observed settings Epic preset, FSR Balanced; the display showed 2024×848 internal to 3440×1440 output. SVGOverwatch observed settings Medium graphics quality with lower textures, shadows and effects; automatic frame rate. SVG
How to read this
Definitions and limits
Average FPS is 1,000 divided by the arithmetic mean of all recorded frame times in milliseconds.
Calculated 1% low is 1,000 divided by the mean of the slowest 1% of frames, rounded up to a whole-frame count. This is not MangoHud's saved percentile-style “1% Min FPS.”
P99 frame time is the 99th percentile threshold of recorded frame times. Frame time is not input latency or network ping.
System RAM used is MemTotal minus MemAvailable from sysstat, including background activity. VRAM and GTT come from amdgpu_top. On this machine they are overlapping views, not separate physical capacity to add to RAM.
Sensor alignment uses approximately one-second samples and the saved capture clock. It does not establish frame-exact causes for a spike.
Scope: no matched Windows or Fedora baseline, no controlled repeat protocol, no proven game-only memory use, and no proof of maximum achievable FPS. Background load varied. Capture durations and scene mixes differ.
Inspect it yourself
Sanitized measurements
The downloadable files preserve all five valid capture windows, including the second Rocket League run. These are derivatives of Jose's saved collector logs; original private run files and footage are not published.
The FPS, frame-time and sensor numbers above are Jose's own September 2026 captures, calculated from the published frame-time samples and published derived sensor intervals. The linked tool documentation explains collection and memory terminology; it is not an independent validation of these personal results.
The video and companion post discuss the experience of playing these games. This report keeps the measurements, definitions and limitations together for closer inspection.